
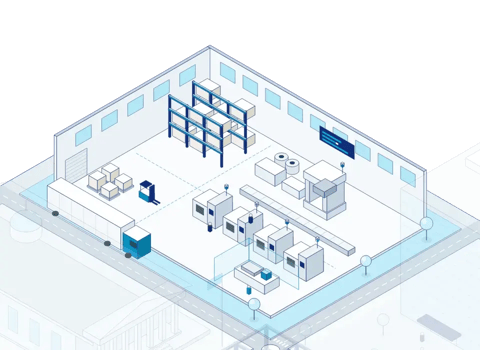
 ManufacturingPlant floor
 Public SectorAgency
 ConstructionStruXure.co
 Custom DevelopmentOffice
The Micro-Stops
The two-minute interruptions that happen dozens of times per day but never get logged.
TrackMeasureImprove
Your ERP system tells you what should happen. Your P&L statement tells you what did happen. Without real-time production monitoring, you are blind to what is happening right now.
Kinetech moves you beyond vanity metrics. We digitize the whole work center by combining raw machine data with critical human context.
The manufacturing landscape has shifted. Today, manufacturers face a new reality where input costs (labor, raw materials, and energy) are rising, yet the market has reached "price fatigue." Your customers are fighting price increases and looking to your competitors. The only sustainable path forward is to extract more value from your existing floor.
Most operational leaders rely on a fragmented view of reality. You have the "plan" in your ERP and the "result" in your financial reports.
Between those two bookends lies the "Operational Blind Spot", the shift-by-shift reality of the shop floor.
When you rely on manual logs, whiteboards, or yesterday’s Excel spreadsheets, you miss the critical moments that erode profitability:
The two-minute interruptions that happen dozens of times per day but never get logged.
Machines running at reduced speeds due to quality or maintenance issues, to boost KPIs, or to extend work to fill a shift.
Knowing a machine stopped, but not knowing it was because the operator was waiting 20 minutes for material handling.
Kinetech closes this gap. We turn the "black box" of your production floor into a transparent, data-driven environment.
A common objection to digital transformation is the age of the equipment. Do not let legacy hardware stall your progress. Kinetech employs a flexible connectivity strategy that respects your IT security and your physical constraints.
For older machines without modern controllers or machines with closed systems, we leverage simple, physical sensors such as current transducers (CTs). These clamp around a power cable to detect when a motor is running or idle without modifying the machine’s wiring.
For modern equipment, we connect directly to PLCs via standard industrial protocols (OPC-UA, Ethernet/IP, Modbus, etc.). This extracts granular data beyond simple uptime, such as cycle counts, speeds, physical material measurements, and error codes.
We respect the air gap between IT and OT. Our solutions are built on Mendix and hosted on AWS or Azure, ensuring enterprise-grade security and high availability without exposing your industrial network to the open internet.
Different roles require different wins. While executive leadership focuses on margin preservation and multi-site consistency, plant managers fight daily battles to manage production schedules. Select your role to see how we transform raw production data into your specific definition of success.
Everyone notices when a critical asset fails for four hours. It is an emergency. Resources are deployed. The problem is fixed.
Few people notice the short, frequent stops. The machine jams for two minutes. The operator waits three minutes for a pallet. A sensor is blocked for ninety seconds. These "micro-stops" often accumulate to hours of lost production every week, yet they feel "normal" to the operator. Because they are short, they are rarely logged in manual reports.
The Kinetech Solution: By monitoring the machine state, we account for all stops and categorize them, no matter how brief. This exposes the silent killers of your capacity and allows you to address the root cause and reclaim hours of productivity - without buying new equipment.
Asset Utilization is the gold standard for many, but it can be misleading if it lacks context.
Example: An operator might run a machine at reduced speed to avoid downtime events, bottlenecks, quality issues, or to fill a shift. The machine’s utilization looks high (the machine rarely stops), but the speed is destroying your throughput.
OEE attempts to address this through Availability, Performance, and Quality factors, but if your shift schedules, product mix, and customer requirements frequently vary, it can be extremely difficult, or even impossible, to calculate systematically.
The Kinetech Solution: We track the Whole Work Center. This means we monitor the machine's relevant properties AND the human context (who is logged in, what job is active, why has the machine stopped). We allow you to systematically and automatically calculate KPIs relevant to you (run rate, utilization, OEE, changeover times) and provide the proper context to evaluate them.
Most manufacturing reports describe what happened yesterday or last month. They are a static snapshot of the past. They do not tell you if you are winning or losing right now.
The Kinetech Solution: Our dashboards act as a portal to real-time operations—like watching live TV.
PLC data can tell you that a machine stopped. It rarely tells you why.
Kinetech bridges the gap between OT (Operational Technology) and IT. By equipping operators with mobile-first interfaces, we capture the critical human context that raw data lacks.
Why This Matters for CapEx: Without this context, you might spend $250,000 to upgrade a machine to run faster or purchase additional machines, only to realize the machine was never the bottleneck. It was simply waiting on the world around it most of the time.
Our methodology contextualizes your data to inform decision-making and make CapEx deployments as effective as possible.
Why did it stop?
Machine Issues A motor overheated. This requires immediate maintenance intervention and time to resolve.
Process Issues The Operator is waiting for a forklift. This requires material handling support, not machine repair.
Scheduling Issues The changeover took too long. This indicates materials were not staged correctly and requires better planning.
In a high-mix manufacturing environment, not all orders are created equal. Two orders might generate the same revenue, but one might require triple the machine time, labor, and changeovers.
Without granular production data, accounting relies on "blended averages" and standards to estimate costs. This hides the reality that complex, custom orders often destroy margins. You could be losing money on 10% of your volume without knowing it.
By tracking the exact start and stop times of every job—down to the second—we allow you to allocate labor and overhead costs to specific orders.
Reliance on fragmented paper records and siloed machine data prevented a major manufacturer from establishing standardized KPIs or gaining real-time shop floor visibility. This data gap forced leadership to rely on lagging financial metrics, hindering cost-reduction efforts and precluding advanced predictive modeling.
We delivered a custom application ecosystem that securely aggregated real-time machine telemetry with critical operator context. This solution preserved their existing workflows while adding a strategic single source of truth for immediate organization-wide visibility.
Unlocked Capacity: 20% increase in machine run rate without CapEx.
20%
Process Speed: 45% reduction in job changeover times.
45%
Data Unity: Total elimination of silos across disparate machine vendors.
Schedule Attainment: Real-time predictive modeling for achievable daily planning.
Operational Stability: Improved OTD and consistency via standardized best practices.
Stop guessing and start measuring. Whether you’re looking at a single facility or a global enterprise, use our interactive tools to build a data-backed business case for digital transformation.
Model the high-level financial impact of shop floor monitoring across your entire enterprise. This calculator translates operational gains into bottom-line growth.
Key Insights:
Dive into the day-to-day economics of your facility. Calculate exactly how much "hidden" capacity you can unlock by reducing downtime and changeover friction.
Key Insights:
From Static Spreadsheets to Dynamic Control
If you manage your production schedule on a whiteboard or a spreadsheet, you are reacting to the past. A spreadsheet does not update itself when a machine goes down at 10:00 AM. This leaves your planning team operating on a schedule that is already obsolete by lunch.
You do not know a schedule is slipping until the shift is over.
See exactly where every order is in the queue in real-time.
Sales teams promise dates based on "standard lead times" rather than actual capacity.
If a work center goes down, drag-and-drop orders to available lines instantly.
Rescheduling requires hours of manual data entry and phone calls to the floor.
Know hours in advance if a shipment will be late. Manage the customer expectation proactively rather than asking for forgiveness.
During the competitive RFP process, Kinetech built a fully functional proof of concept that perfectly mirrored their proven 30-year workflow.
"The software was already built. We could see exactly how it would work for us."
- VP Operations
Zero Disruption to Operations: 30-year manufacturing workflow preserved while gaining digital precision
Perfect Fit: Software that enhances rather than replaces proven methods
Mobile Excellence: Production floor teams operate with real-time visibility and control
Bulletproof Reliability: AWS with fallback prevents the downtime and system failures that derailed their previous solution
"We build software around your process—not the other way around."
- Ricky Volz, Kinetech Partner
If you don't need to build your own and just want these capabilities, MACH is for you.
Schedule a Discovery Call (1 Hour)
Discuss your challenges and identify what makes your operations unique.
Book Discovery CallRequest a Custom POC
See a working proof of concept of your specific workflows within weeks.
Calculate Potential Savings & ROI
Calculate the cost of existing operational inefficiencies and the potential ROI of adopting a Kinetech solution.
AI in Manufacturing
Real-time monitoring tells you what's happening. Active Intelligence takes it further — detecting problems before they cascade, rerouting jobs autonomously, and keeping production moving while your team sleeps.
Explore AI in Manufacturing →Production monitoring captures real-time machine and operator data, closing the blind spot between your ERP plan and what actually happens on the floor. Kinetech's Manufacturing Cloud makes this visibility available without replacing your existing systems.
Yes. Kinetech connects through non-invasive sensors that clamp around power cables, direct integration via standard protocols like OPC-UA and Modbus, or cloud hosting with a security boundary between IT and OT networks.
OEE is hard to calculate consistently when schedules and product mix vary. Kinetech tracks the whole work center, combining machine data with operator context, so you get accurate numbers instead of a misleading average.
Dashboards replace static end-of-shift reports. You see slippage while there is still time to act, enabling proactive customer updates and resource shifts instead of after-the-fact firefighting.
Yes. Tracking exact job start and stop times allocates labor and overhead per order, exposing complex or custom work that erodes margin under blended averages. A steel manufacturer used this visibility to reach a 20% increase in machine run rate and a 45% reduction in job changeover time.